Dataclasses vs Attrs vs Pydantic

Posted by Jack McKew on Fri 07 August 2020 in Data Science • Tagged with datascience, python • 6 min read

Python 3.7 introduced dataclasses, a handy decorator that can make creating classes so much easier and seamless. This post will go into comparing a regular class, a 'dataclass' and a class using attrs. Dataclasses were based on attrs, which is a python package that also aims to make creating …


Continue reading

Generators in Python

Posted by Jack McKew on Thu 30 July 2020 in Data Science • Tagged with datascience, python • 4 min read

Generators are a special type of function in python, letting you 'lazy load' data; a function becomes a generator is with the yield statement. Lazy loading is when you access just a portion of a data set that you are interested in (eg, the part you are working with), as …


Continue reading

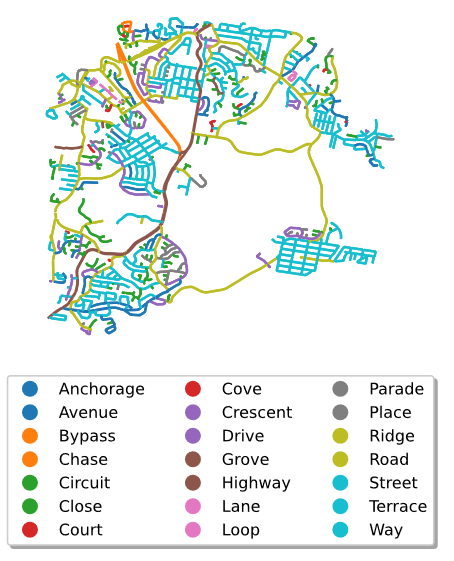
Street Suffix Analysis & Colouring with Python

Posted by Jack McKew on Fri 24 July 2020 in Data Science • Tagged with datascience, python • 5 min read

Street Suffix Visualisation with Python

Ever thought about how roads and streets are named where you live? How many are roads versus how many are streets? Is there a specific pattern to it where you live or is it just random? This post is going to go into how to …


Continue reading

Sentiment Analysis & Text Cleaning in Python with Vader

Posted by Jack McKew on Fri 17 July 2020 in Data Science • Tagged with datascience, python • 8 min read

Sentiment Analysis in Python with Vader

Sentiment analysis is the interpretation and classification of emotions (positive, negative and neutral) within text data using text analysis techniques. Essentially just trying to judge the amount of emotion from the written words & determine what type of emotion. This post we'll go into how …


Continue reading

How Pandas_Alive was Made

Posted by Jack McKew on Fri 26 June 2020 in Python • Tagged with Python • 5 min read

Pandas-Alive is an open source Python package for making animated charts from Pandas dataframes. This project was first inspired by a very specific COVID-19 visualisation, so I set out to make this visualisation a reality.

This visualisation consisted of a bar chart race showing regions, a line chart showing new …


Continue reading

Geopandas and Pandas Alive

Posted by Jack McKew on Fri 12 June 2020 in Python • Tagged with python, visualisation • 6 min read

Geopandas and Pandas_Alive

Following on from a previous post on making animated charts with pandas_alive, let's go into generating animated charts specifically for geospatial data with geopandas. Support for geopandas was introduced into pandas_alive in version 0.2.0, along with functionality to interface with contextily for enabling basemaps. The …


Continue reading

Make a README & Documentation with Jupyter Notebooks

Posted by Jack McKew on Fri 05 June 2020 in Python • Tagged with python • 5 min read

README is typically the front page of a project, and should contain relevant information for current users & prospective users. As to make sure documentation across a project is consistent as well, imagine if we could include this README that is the front page of our project, both on the repository …


Continue reading

Translating Text in Python

Posted by Jack McKew on Fri 29 May 2020 in Data Science • Tagged with datascience, python • 9 min read

Massive thank you to Chema, who translated this article himself into Spanish! Check it out at: https://www.ibidemgroup.com/edu/traduccion-automatica-texto-python/

Working with data in a connected digital world, means you will possibly encounter data in a language outside your own. In this post we'll go into ways to …


Continue reading

Creating Animated Plots with Pandas_Alive

Posted by Jack McKew on Thu 21 May 2020 in Data Science • Tagged with datascience, python, data-viz, datavisualisation • 5 min read

In this tutorial we'll learn how to create a series of animations using Pandas_Alive. This post is rendered in the style of a Jupyter Notebook. Find the source here: https://github.com/JackMcKew/jackmckew.dev/tree/master/content/2020/pandas_alive/notebooks/pandas_alive_demo.ipynb.

Pandas_Alive was created by me! I set …


Continue reading

COVID-19 Confirmed Cases NSW Australia - Animated Statistics over Time

Posted by Jack McKew on Thu 14 May 2020 in Data Science • Tagged with datascience, python, data-viz, datavisualiation • 1 min read

Recently, I had wanted to build a visualisation of the confirmed cases of COVID-19 in my home state NSW. This post is to cover the release of the visualisation on YouTube, and there is hopes to write future post(s) about building this visualisation & developing Pandas_Alive. Would love to hear …


Continue reading