Creating Animated Plots with Pandas_Alive

Posted by Jack McKew on Thu 21 May 2020 in Data Science • Tagged with datascience, python, data-viz, datavisualisation • 5 min read

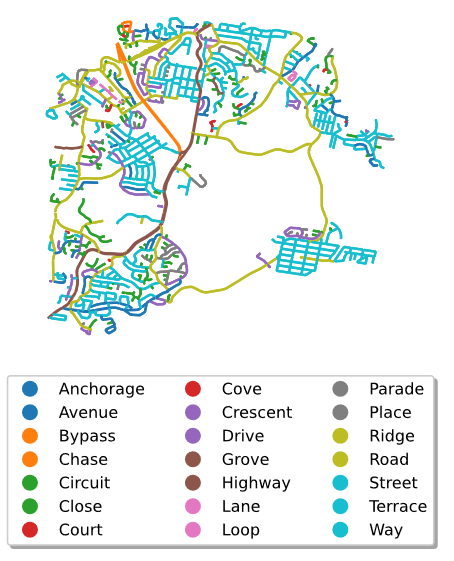
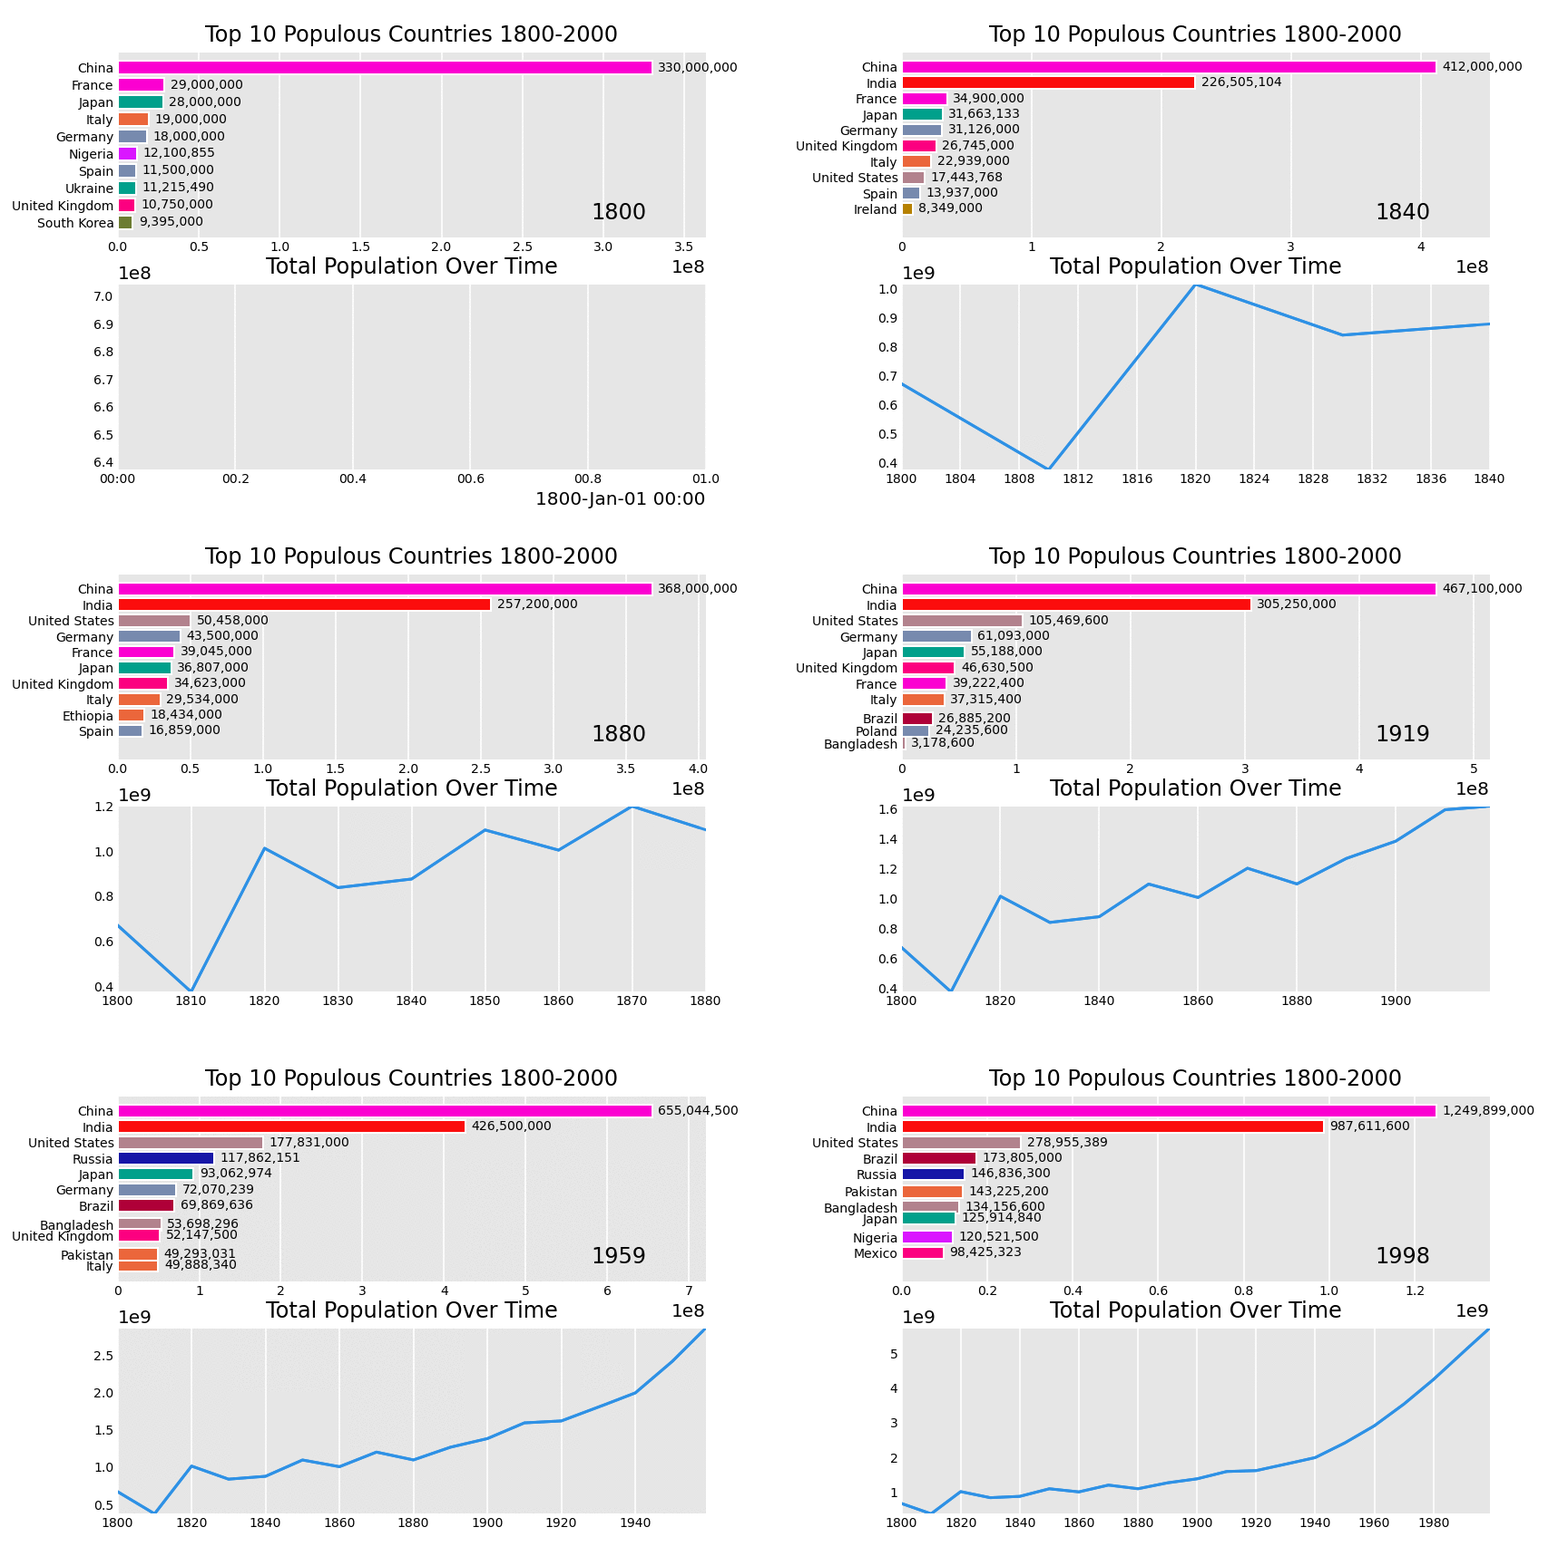
In this tutorial we'll learn how to create a series of animations using Pandas_Alive. This post is rendered in the style of a Jupyter Notebook. Find the source here: https://github.com/JackMcKew/jackmckew.dev/tree/master/content/2020/pandas_alive/notebooks/pandas_alive_demo.ipynb.

Pandas_Alive was created by me! I set …


Continue reading

COVID-19 Confirmed Cases NSW Australia - Animated Statistics over Time

Posted by Jack McKew on Thu 14 May 2020 in Data Science • Tagged with datascience, python, data-viz, datavisualiation • 1 min read

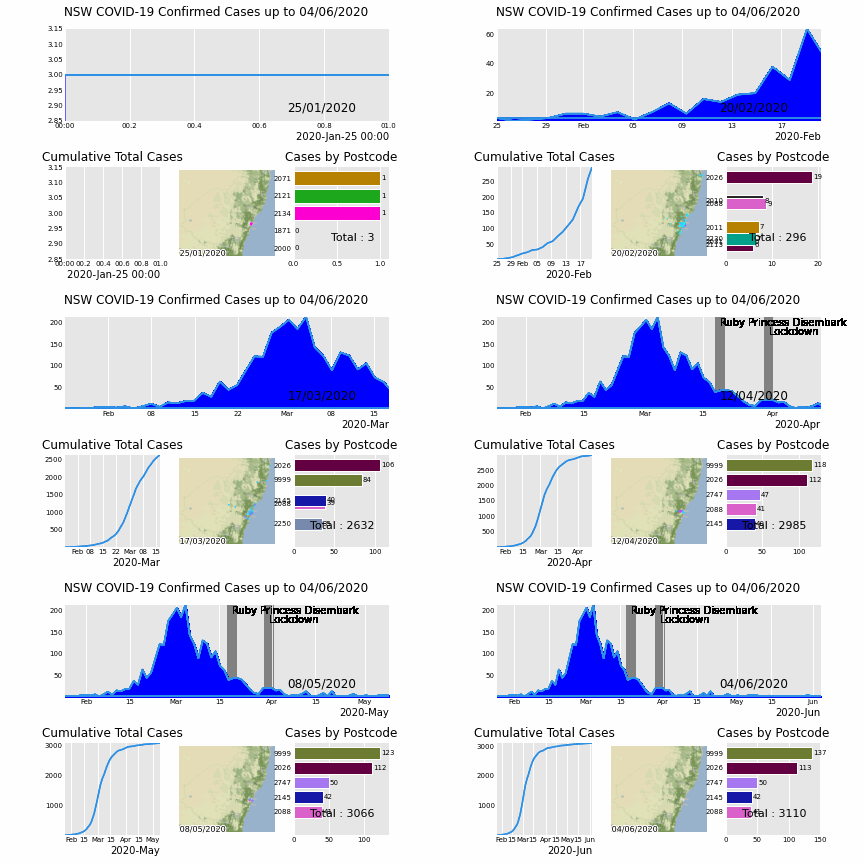
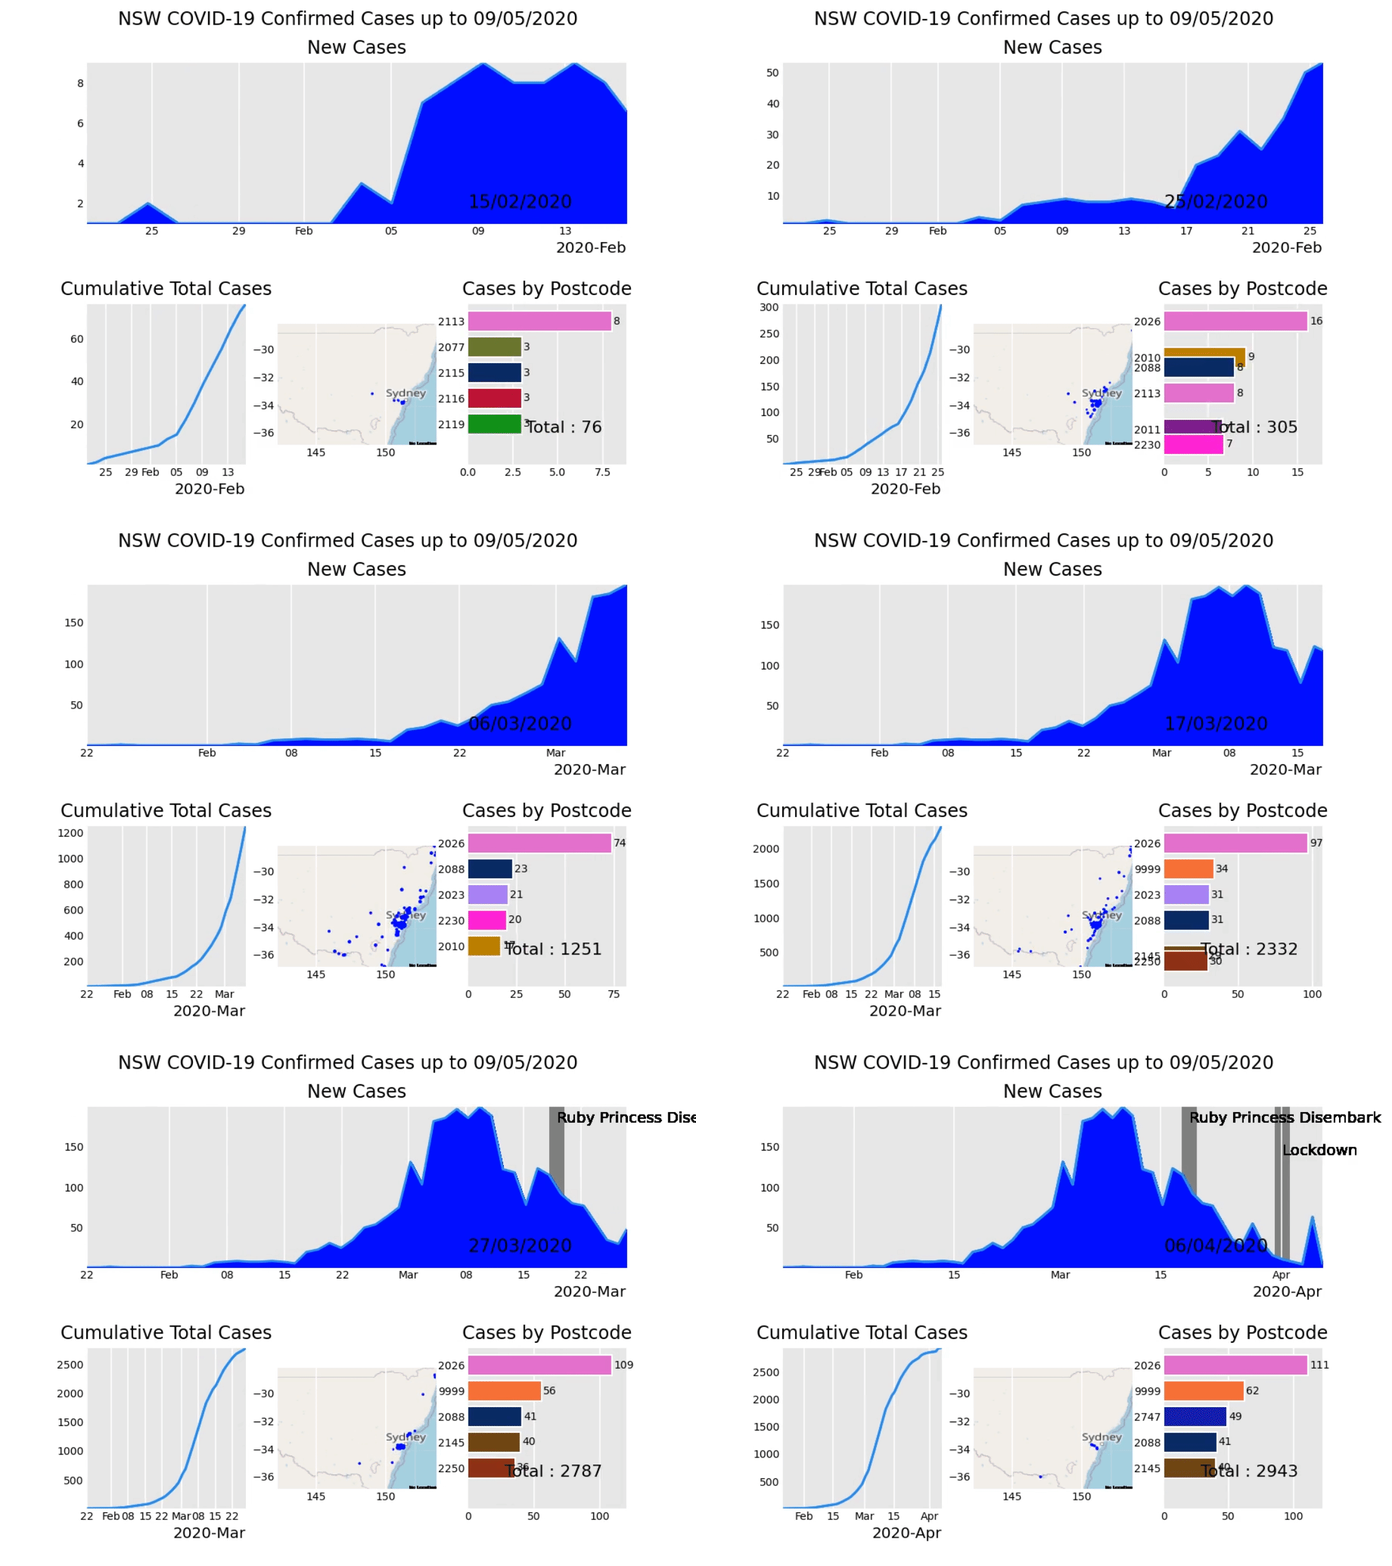
Recently, I had wanted to build a visualisation of the confirmed cases of COVID-19 in my home state NSW. This post is to cover the release of the visualisation on YouTube, and there is hopes to write future post(s) about building this visualisation & developing Pandas_Alive. Would love to hear …


Continue reading

3D Gradient Descent in Python

Posted by Jack McKew on Wed 26 February 2020 in Python • Tagged with python, visualisation, generative • 40 min read

Visualising gradient descent in 3 dimensions

Building upon our terrain generator from the blog post: https://jackmckew.dev/3d-terrain-in-python.html, today we will implement a demonstration of how gradient descent behaves in 3 dimensions and produce an interactive visualisation similar to the terrain visualisation. Note that my understanding of gradient …


Continue reading

3D Terrain in Python

Posted by Jack McKew on Fri 24 January 2020 in Python • Tagged with python, visualisation, generative • 21 min read

Generating & Visualising 3D Terrains in Python

Today, let's put together a 3D visualisation of randomly generated 'terrain' with Python. Data visualisation is an absolutely key skill in any developers pocket, as communicating both data, analysis and more is thoroughly simplified through the use of graphs. While a picture tells a …


Continue reading

Intro To GeoPandas

Posted by Jack McKew on Wed 15 January 2020 in Python • Tagged with python, visualisation • 6 min read

Pandas for geospatial data

Personally whenever I am faced with a problem that involves analysing geospatial data, GeoPandas is the first tool/package I reach for. Extending on the Pandas dataframe data structure, GeoPandas brings functionality for working with points, polygons and more out of the box. This post is …


Continue reading

Linear Regression: Under the Hood with the Normal Equation

Posted by Jack McKew on Sun 25 August 2019 in Data Science • Tagged with python • 3 min read

Let's dive deeper into how linear regression works.

Linear regression follows a general formula:

$$ \hat{y} = \theta_0 + \theta_1x_1 + \theta_2x_2 + \cdots + \theta_nx_n $$

Where \(\hat{y}\) is the predicted value, \(n\) is the number of features, \(x_i\) is the \(i^{th}\) feature value and \(\theta_n\) is the \(n^{th}\) model parameter. This …


Continue reading

Looking for Patterns in City Names & Interactive Plotting

Posted by Jack McKew on Fri 16 August 2019 in Python • Tagged with python, datascience • 5 min read

Recently, I was traveling around New Zealand, and noticed in the Maori language they use letters back to back a lot like in the original Maori name for Stratford ("whakaahurangi"). So as any normal person does, I thought, well what town has the most repeated letters, and the idea for …


Continue reading

What is MongoDB?

Posted by Jack McKew on Fri 03 May 2019 in Software Development • Tagged with database, mongodb • 3 min read

Recently after looking for a different flavour of database apart from MySQL (which is what I am personally use to), I had always heard about MongoDB. So after some investigation, I found that MongoDB has a platform MongoDB University to familiarize yourself with their product.

I completed their very first …


Continue reading

Efficient Frontier for Balancing Portfolios

Posted by Jack McKew on Fri 26 April 2019 in Python • Tagged with python, data, analysis • 5 min read

Following last 2 weeks’ posts (Python for the Finance Industry & Portfolio Balancing with Historical Stock Data), we now know how to extract historical records on stock information from the ASX through an API, present it in a graph using matplotlib, and how to balance a portfolio using randomly generated portfolios …


Continue reading

Portfolio Balancing with Historical Stock Data

Posted by Jack McKew on Fri 19 April 2019 in Python • Tagged with finance, python • 4 min read

Following last weeks' post (Python for the Finance Industry). This post is to demonstrate a method of determining an optimized portfolio based on historical stock price data.

First of all while attempting to tackle this problem, I stumbled across many very informative articles in which based on what I learned …


Continue reading