Getting Started with P5.js

Posted by Jack McKew on Fri 25 December 2020 in Javascript • Tagged with javascript, data-viz • 2 min read

In this post we're going to make use of the library P5.js which enables us to create interactive visualisation in the browser. We're going to create an interactive pond where users will be able to click on the screen to create a new drop in the pond and watch …


Continue reading
Interactive Random Walkers with Javascript

Posted by Jack McKew on Fri 03 July 2020 in Javascript • Tagged with javascript, data-viz • 2 min read

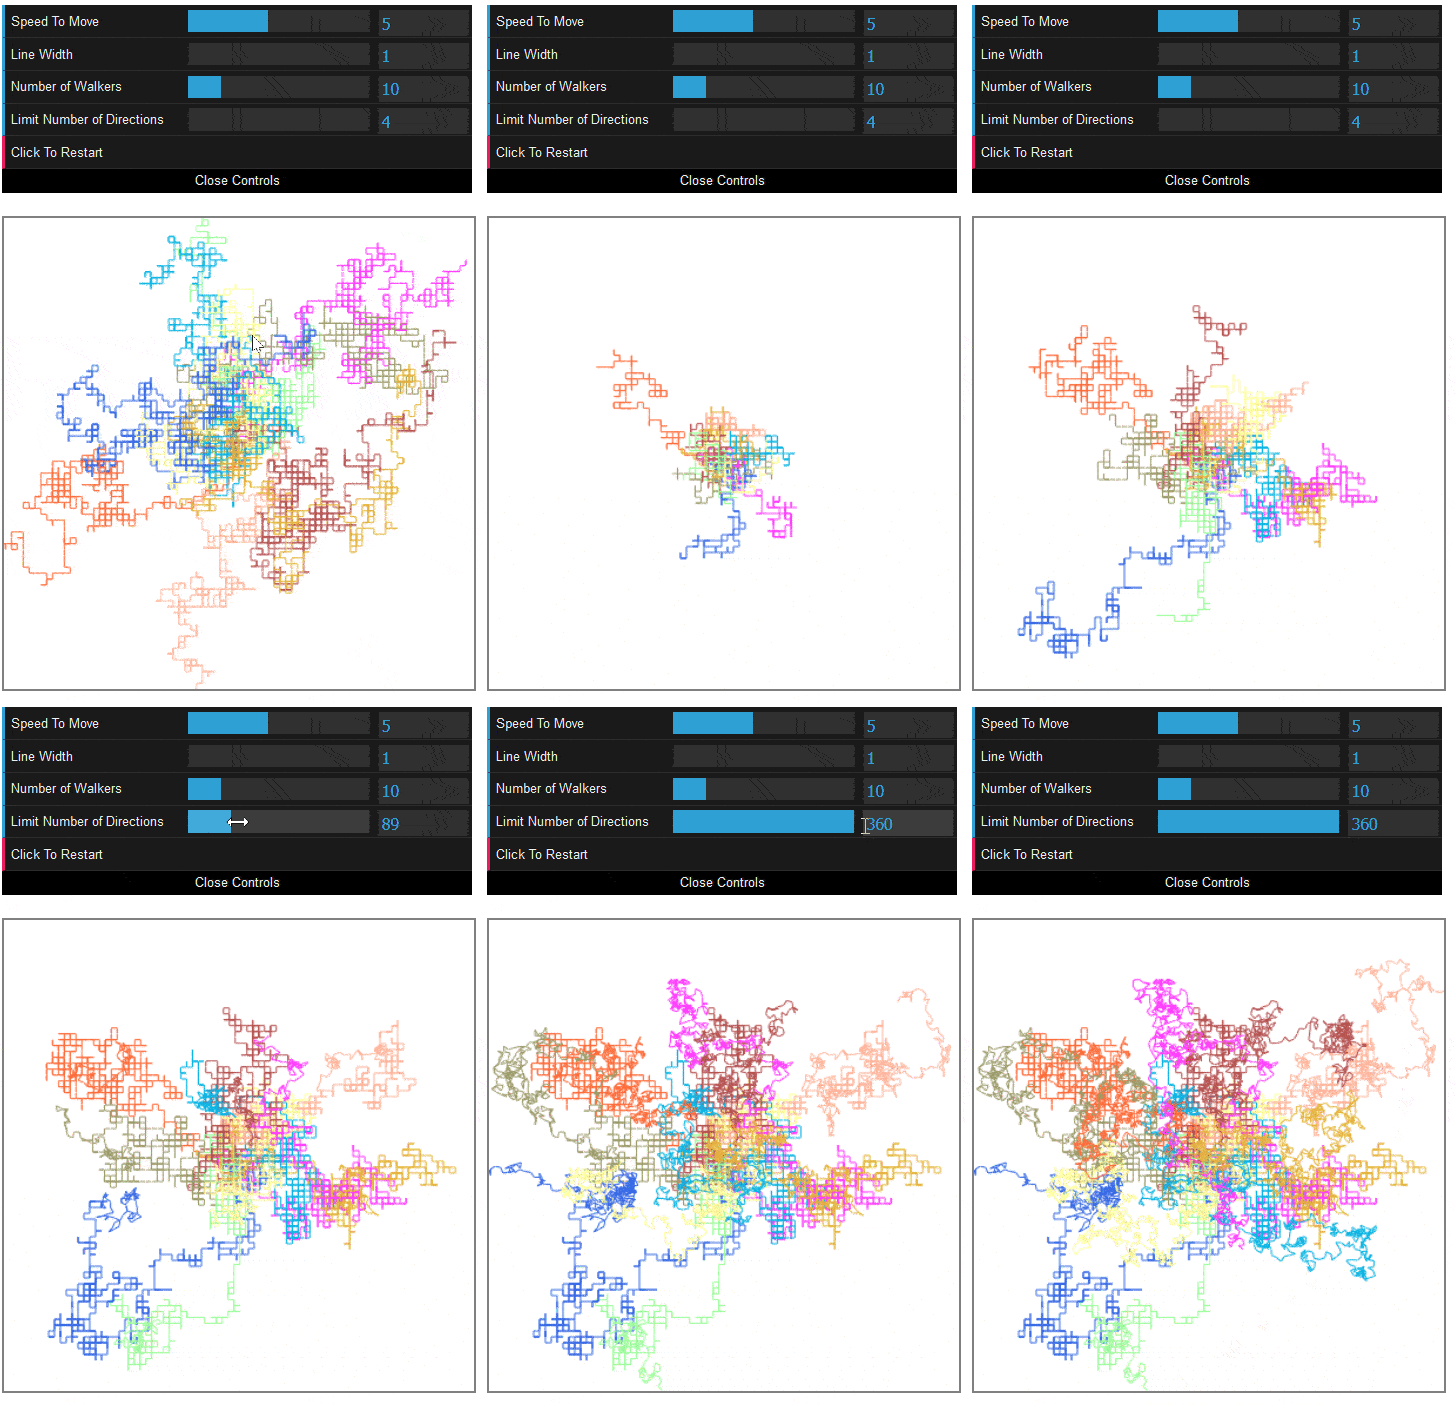
Random walks are where randomly-moving objects move around, that's it. The most fascinating part about it is how many seemingly 'patterns' emerge from the random behaviour, and that everyone sees something different in the visualisations. In this post, let's build an interactive random walk visualisation with Javascript. Let's control the …


Continue reading

Simulate Virus Outbreak with Javascript

Posted by Jack McKew on Thu 09 April 2020 in Javascript • Tagged with javascript, data-viz • 2 min read

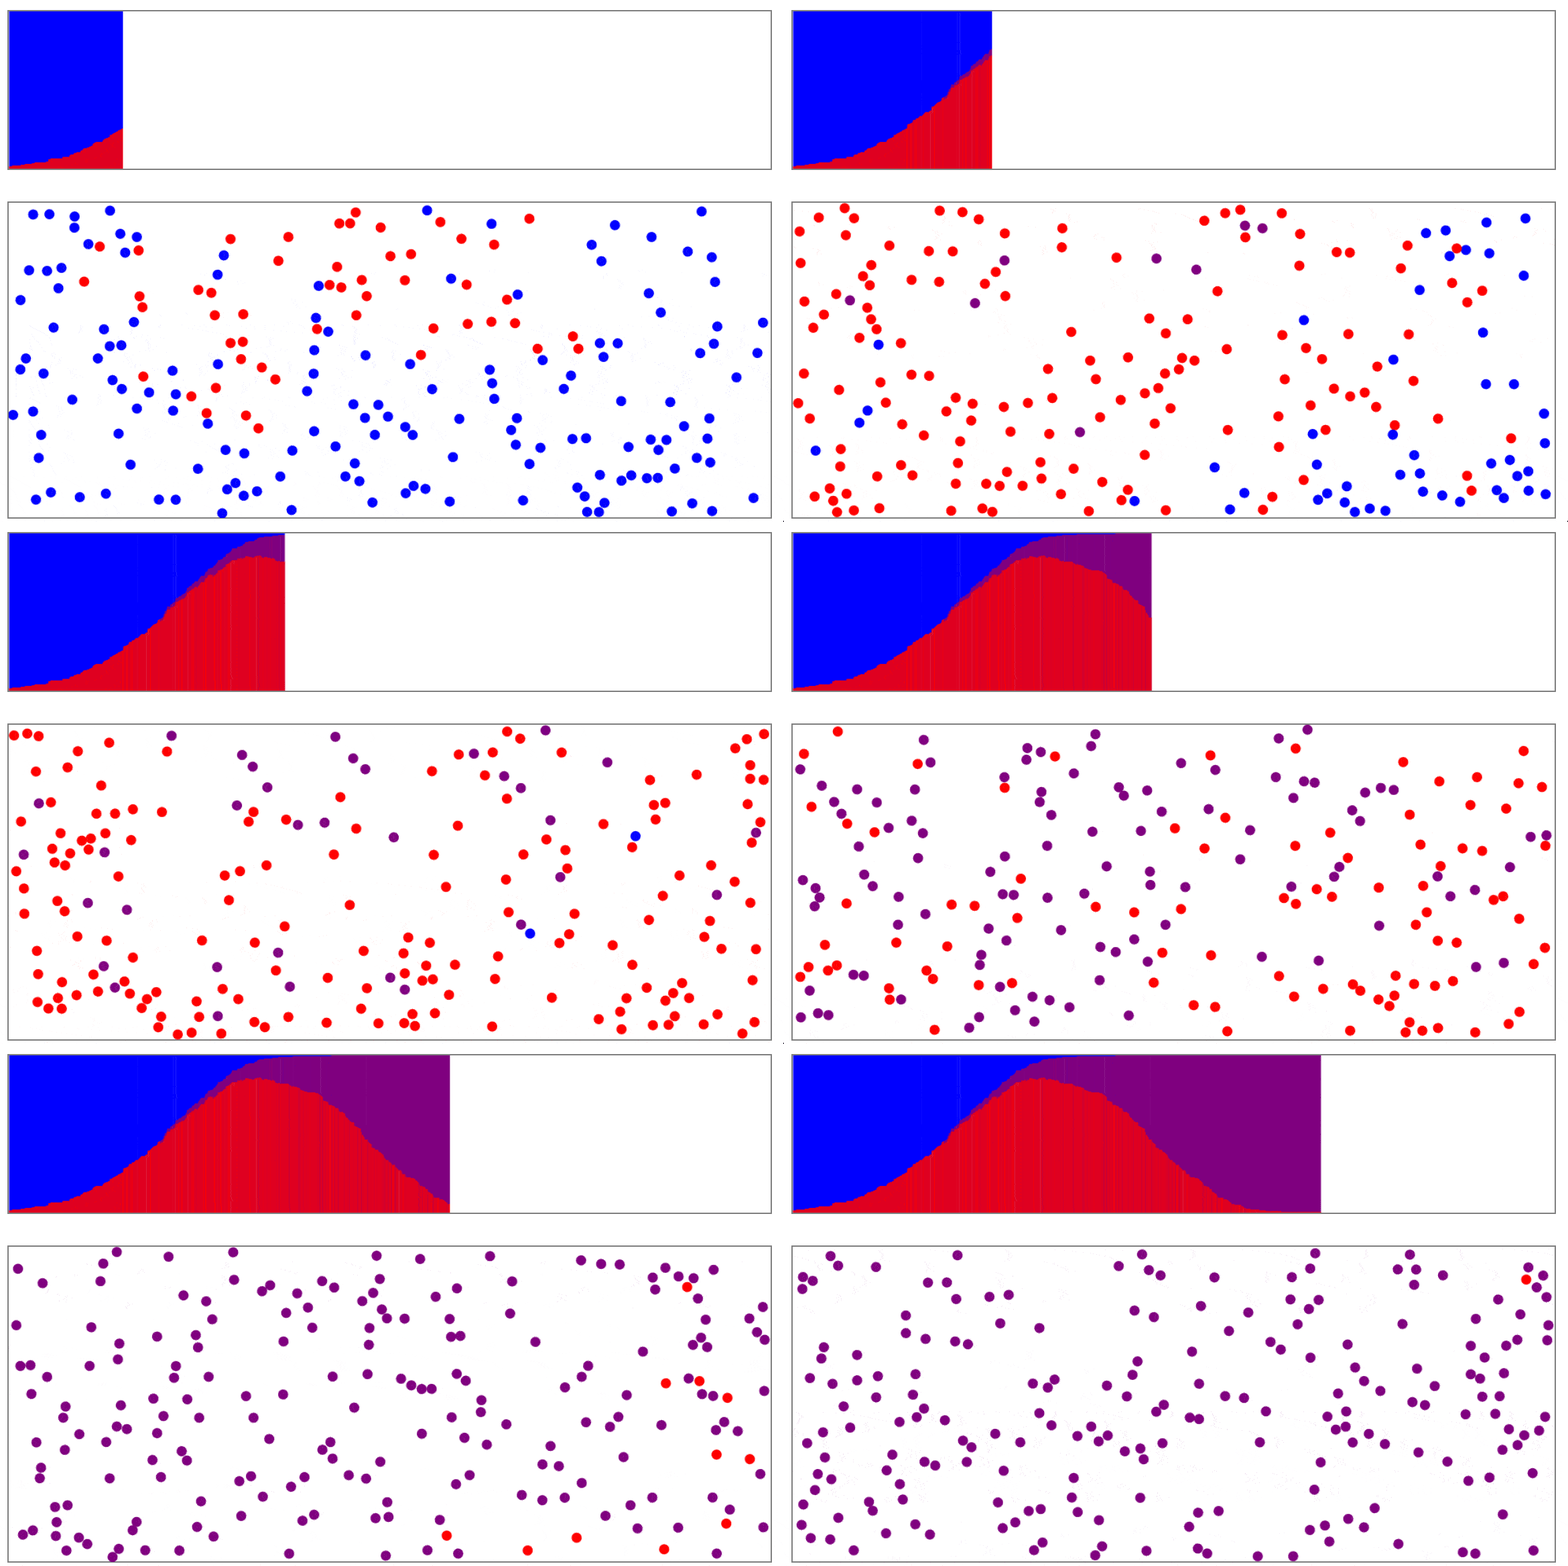
This post will and simulate how viruses can spread throughout a community and implement a variety of different parameters to see how these affect the simulation. This is following on from last week's post on how to do a bouncing ball simulation with the canvas API https://jackmckew.dev/pelican-and-javascript-bouncing-balls-in-canvas …


Continue reading

Pelican and Javascript - Bouncing Balls in Canvas

Posted by Jack McKew on Thu 02 April 2020 in Javascript • Tagged with javascript, data-viz • 3 min read

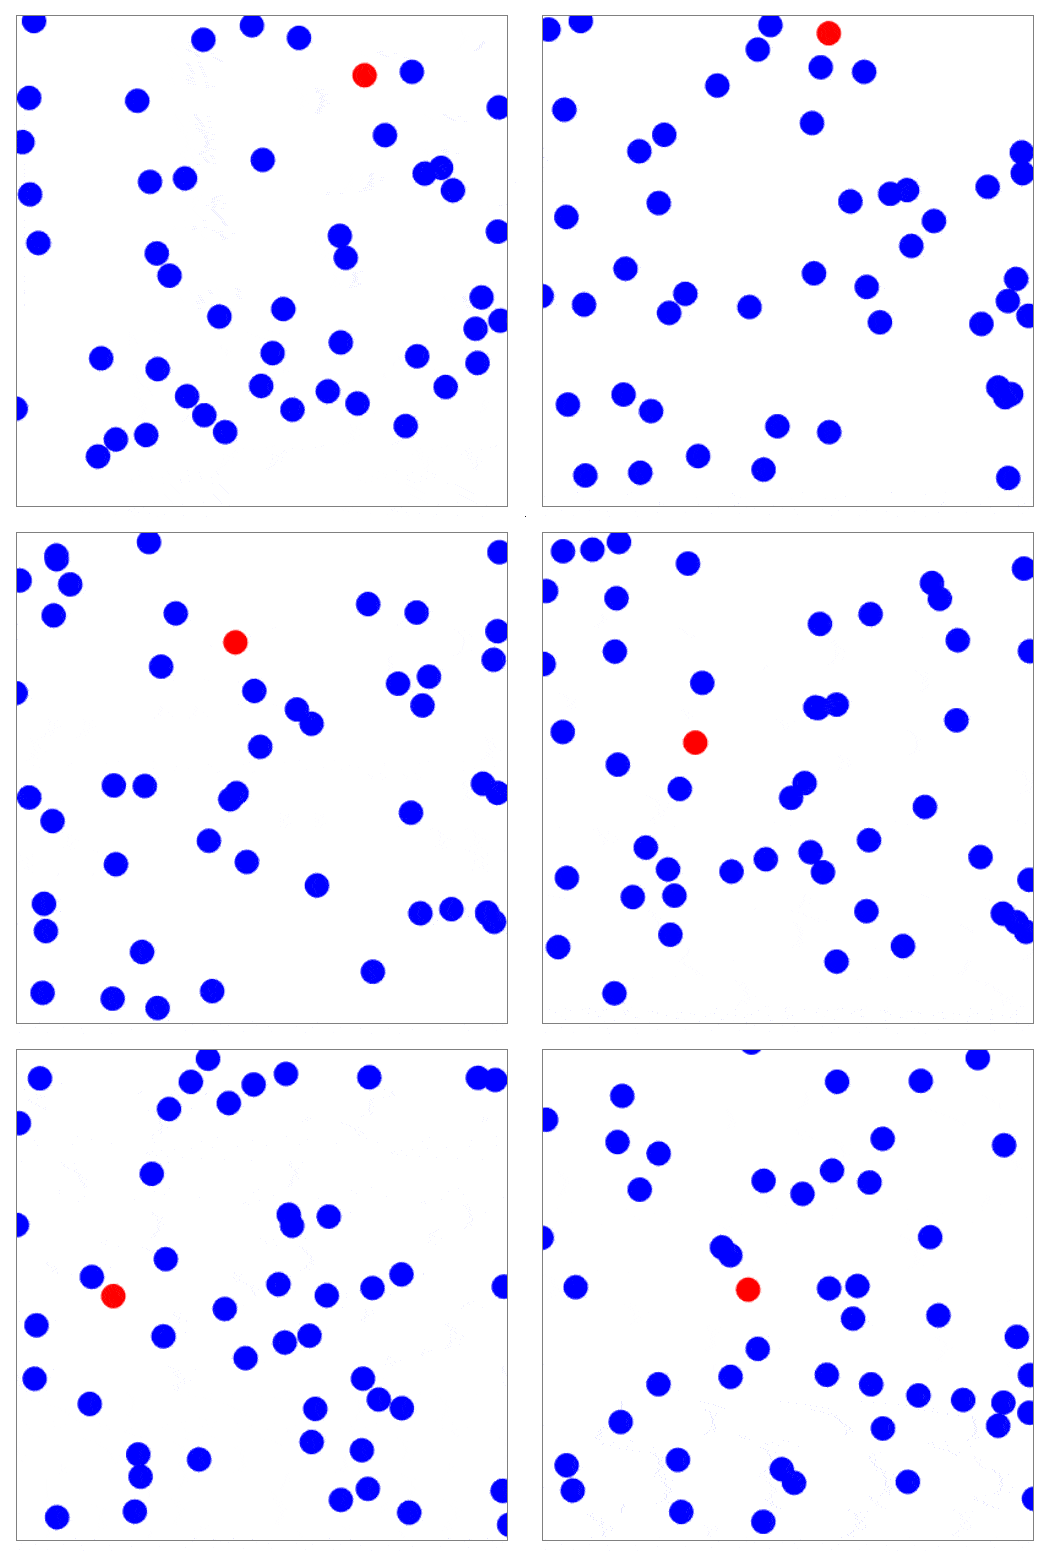
Today let's look into building a visualisation of some bouncing balls with Javascript. The inspiration for building this comes from Harry Stevens over at the Washington Post for his amazing piece of data journalism around the coronavirus.

Here is a gif of the current version of my bouncing balls using …


Continue reading