Geopandas and Pandas Alive

Posted by Jack McKew on Fri 12 June 2020 in Python • Tagged with python, visualisation • 6 min read

Geopandas and Pandas_Alive

Following on from a previous post on making animated charts with pandas_alive, let's go into generating animated charts specifically for geospatial data with geopandas. Support for geopandas was introduced into pandas_alive in version 0.2.0, along with functionality to interface with contextily for enabling basemaps. The …


Continue reading

Make a README & Documentation with Jupyter Notebooks

Posted by Jack McKew on Fri 05 June 2020 in Python • Tagged with python • 5 min read

README is typically the front page of a project, and should contain relevant information for current users & prospective users. As to make sure documentation across a project is consistent as well, imagine if we could include this README that is the front page of our project, both on the repository …


Continue reading

Translating Text in Python

Posted by Jack McKew on Fri 29 May 2020 in Data Science • Tagged with datascience, python • 9 min read

Massive thank you to Chema, who translated this article himself into Spanish! Check it out at: https://www.ibidemgroup.com/edu/traduccion-automatica-texto-python/

Working with data in a connected digital world, means you will possibly encounter data in a language outside your own. In this post we'll go into ways to …


Continue reading

Creating Animated Plots with Pandas_Alive

Posted by Jack McKew on Thu 21 May 2020 in Data Science • Tagged with datascience, python, data-viz, datavisualisation • 5 min read

In this tutorial we'll learn how to create a series of animations using Pandas_Alive. This post is rendered in the style of a Jupyter Notebook. Find the source here: https://github.com/JackMcKew/jackmckew.dev/tree/master/content/2020/pandas_alive/notebooks/pandas_alive_demo.ipynb.

Pandas_Alive was created by me! I set …


Continue reading

COVID-19 Confirmed Cases NSW Australia - Animated Statistics over Time

Posted by Jack McKew on Thu 14 May 2020 in Data Science • Tagged with datascience, python, data-viz, datavisualiation • 1 min read

Recently, I had wanted to build a visualisation of the confirmed cases of COVID-19 in my home state NSW. This post is to cover the release of the visualisation on YouTube, and there is hopes to write future post(s) about building this visualisation & developing Pandas_Alive. Would love to hear …


Continue reading

Book Review: Never Split the Difference

Posted by Jack McKew on Thu 07 May 2020 in Book Reviews • Tagged with bookreview, principles • 2 min read

Never Split the difference by Chris Voss & Tahl Raz is a fantastic book how handling negotiations effectively. Chris is a former hostage negotiator for the FBI involving terrorist & kidnapping situations, this book helps you gain insight into how he dealt with negotiations then, and practical examples you can use in …


Continue reading

Managing Virtual Environments on Windows

Posted by Jack McKew on Thu 30 April 2020 in Python • Tagged with Python • 3 min read

Managing virtual environments for Python on Windows was never straightforward in my experience. There is so many different tools available (which is fantastic!), it's difficult to find the right combination for Python projects. This post is for the combination of tools that work for my application, if there are any …


Continue reading

Github Actions for CI/CD

Posted by Jack McKew on Thu 23 April 2020 in Software • Tagged with software, cicd • 4 min read

Recently the Python Bytes Awesome Package List moved to it's own repository from the blog post. This was done to enable the community be able to contribute their packages that they thought were awesome, which was a success with many pull requests already merged.

After getting a taste of CI …


Continue reading

Find Nth Visible Cell with VBA - Excel

Posted by Jack McKew on Fri 17 April 2020 in Excel • Tagged with vba, excel • 4 min read

Excel is the undisputed leader in the spreadsheet world, with over 750 million users worldwide. It is a household name when it comes to analyzing data, so personally I find myself in Excel for most of the work I do. One powerful option that in my experience is underused is …


Continue reading

Simulate Virus Outbreak with Javascript

Posted by Jack McKew on Thu 09 April 2020 in Javascript • Tagged with javascript, data-viz • 2 min read
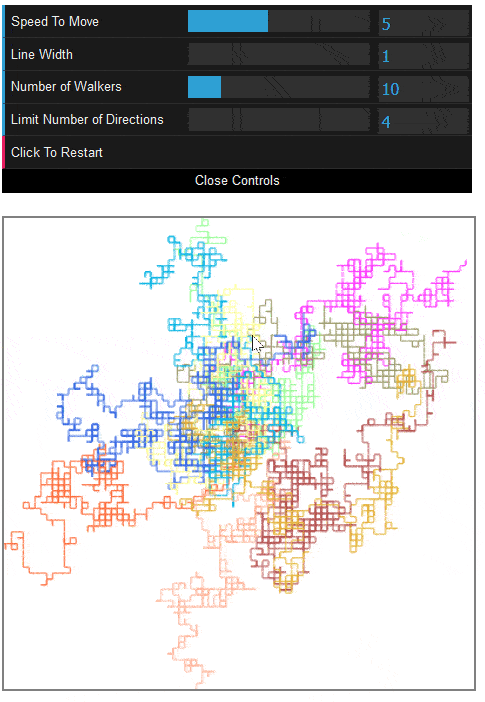
This post will and simulate how viruses can spread throughout a community and implement a variety of different parameters to see how these affect the simulation. This is following on from last week's post on how to do a bouncing ball simulation with the canvas API https://jackmckew.dev/pelican-and-javascript-bouncing-balls-in-canvas …


Continue reading