Typography With Matplotlib
Posted on Fri 08 January 2021 in Python • 3 min read
Typography is 'the style and appearance of printed matter', so in this post we're going to make some typography art with Matplotlib, we're going to make use of some text and colour the words which are colours themmselves (eg, the colour red will be coloured red). This is an interesting dive into how to structure data to be processed. Before we get into how to create this, let's take a look at the output!
Now to create the above image, we need some text, and that text would hopefully make use of worded colours more than once and in different colors. This site has lots of great examples, and we shall take an excerpt out of it https://www.shortparagraph.com/paragraphs/paragraph-on-the-meaning-of-colours-by-anand/3221.
To start off, we use a triple out, which denotes a multiline string in Python, this let's us use newlines (the enter key) throughout a single string.
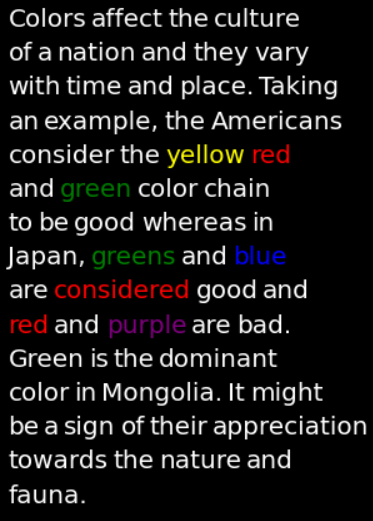
example_sentence = """
Colors affect the culture of a nation and they vary with time and place. Taking an example, the Americans consider the yellow red and green color chain to be good whereas in Japan, greens and blue are considered good and red and purple are bad. Green is the dominant color in Mongolia. It might be a sign of their appreciation towards the nature and fauna.
"""
Next up we need to import the dependancies of packages we wish to use (matplotlib). To make our lives even easier, there's a list of named colours inbuilt into matplotlib! To see them all, head to https://matplotlib.org/3.1.0/gallery/color/named_colors.html. We're going to make use of the CSS colours in this directory.
import matplotlib.pyplot as plt
import matplotlib.colors as mcolors
Next we create a function that's going to analyse all the words in the text, determine if the named colour exists (even in the substring), and create a new list of same length as the number of words that we will use to colour them later on. We split the text by spaces to create a list where each element in the list is a string of the single word, and initilise two lists that we will fill. We iterate over each word, and check if the named colour exists in the substring, if it does then we append that colour into the colour list, if not then we give it a fall back colour (defaults to black for a white canvas). Finally the function returns both the lists in a tuple which we can extract from the function return.
def find_color_word(text,color_dictionary,base_color='black'):
    split_text = text.split(' ')
    color_list = []
    word_list = []
    for word in split_text:
        for color in color_dictionary.keys():
            if color in word:
                color_list.append(color)
        word_list.append(word.strip('\n'))
        if len(word_list) != len(color_list):
            color_list.append(base_color)
    return word_list,color_list

words, colors = find_color_word(example_sentence,mcolors.CSS4_COLORS,'white')

print(words[20:25])
print(colors[20:25])
Next we need to take these two lists to construct our typography art. We create a function that initialises a canvas, iterates over our two lists (with zip), and word by word places them on the canvas with the colour specified, finally returning the canvas that could be used in a figure.
def plot_colored_text(ax,words,colors, space=0.01, w=0.2, w_limit=0.75, y=1, y_diff=0.1):
    r = f.canvas.get_renderer()
    original_w = w
    for word, color in zip(words,colors):
        t = ax.text(w, y, word,color=color,fontsize=12,ha='left')
        transf = ax.transData.inverted()
        bb = t.get_window_extent(renderer=f.canvas.renderer)
        bb = bb.transformed(transf)
        w = w + bb.xmax-bb.xmin + space
        if w > w_limit:
            w = original_w
            y = y - y_diff
    return ax
Now we've got a canvas, it's time to plot!
f = plt.figure(figsize=(4,3), dpi=120)
f.set_facecolor('black')
ax = f.add_subplot(111)
ax.axis('off')

plot_colored_text(ax,words,colors)

plt.show()