Hands On Machine Learning Chapter 3
Posted on Sat 12 October 2019 in Machine Learning • 3 min read
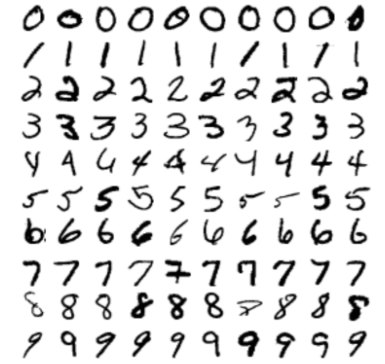
Chapter 3 is focusing in on classification systems. As brought up earlier, most common supervised machine learning tasks are regression (predicting values) and classification (predicting classes). This chapter goes through the 'Hello World' of classification tasks, the MNIST dataset. The MNIST dataset is a set of 70,000 images of handwritten digits written by high school students and employees of the US Census Bureau. Thankfully each image is also labelled with the digit it represents.
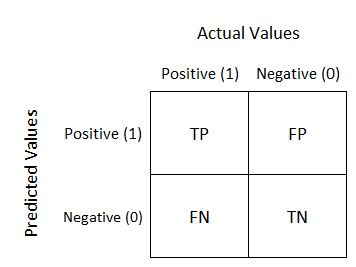
Chapter 3 also introduces one of my personal favourite ways of evaluating classification performance, a confusion matrix. A confusion matrix is built up of rows and columns, rows representing the actual classification and columns representing the predicted classification. In a perfect classifier, the diagonal from left to right will be full of numbers (true positives (TP) and true negatives (TN) and every where else will be 0. Whenever there is a number to the upper right of the diagonal, this represents any false positives (FP), while the lower left of the diagonal, representing false negatives (FN).
Another way to assess the performance is to use the accuracy of the positive predicts, called the precision of the classifier.
Another metric that goes hand-in-hand with precision is the recall of a classifier. Which is the ratio of true positives that are correctly classified.
Or you can combine both precision and recall into a single metric, namely the F1 score. The F1 score is the harmonic mean of precision and recall. The harmonic mean gives much more weight to the low values, meaning the F1 score will only be high if the recall and precision are high.
Precision/Recall Tradeoff
As above, when comparing precision and recall, you cannot have 100% of either, instead it is a trade off. With a precision of 100%, means all the samples classified as positive are true positives, however there may be a lot more that are now false positives. With a recall of 100%, all samples classified will include all of the true positives, however now all the false positives are included.
Deciding the trade off comes down to the application. For example, if you wanted to create a classifier that detects websites that are safe for kids, you would prefer a classifier that rejects many good websites (low recall), but keeps only safe ones (high precision). On the other hand, if you wanted to create a classifier that detects threats in messages, it is probably fine to have a 25% precision, as long as it has 99% recall; meaning the authorities will get a few false alerts, but almost all threats will be identified.