Typography With Matplotlib

Posted by Jack McKew on Fri 08 January 2021 in Python • Tagged with python, visualisation • 3 min read

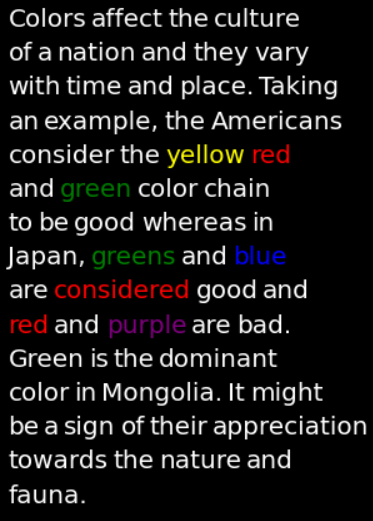
Typography is 'the style and appearance of printed matter', so in this post we're going to make some typography art with Matplotlib, we're going to make use of some text and colour the words which are colours themmselves (eg, the colour red will be coloured red). This is an interesting …


Continue reading

Geopandas and Pandas Alive

Posted by Jack McKew on Fri 12 June 2020 in Python • Tagged with python, visualisation • 6 min read

Geopandas and Pandas_Alive

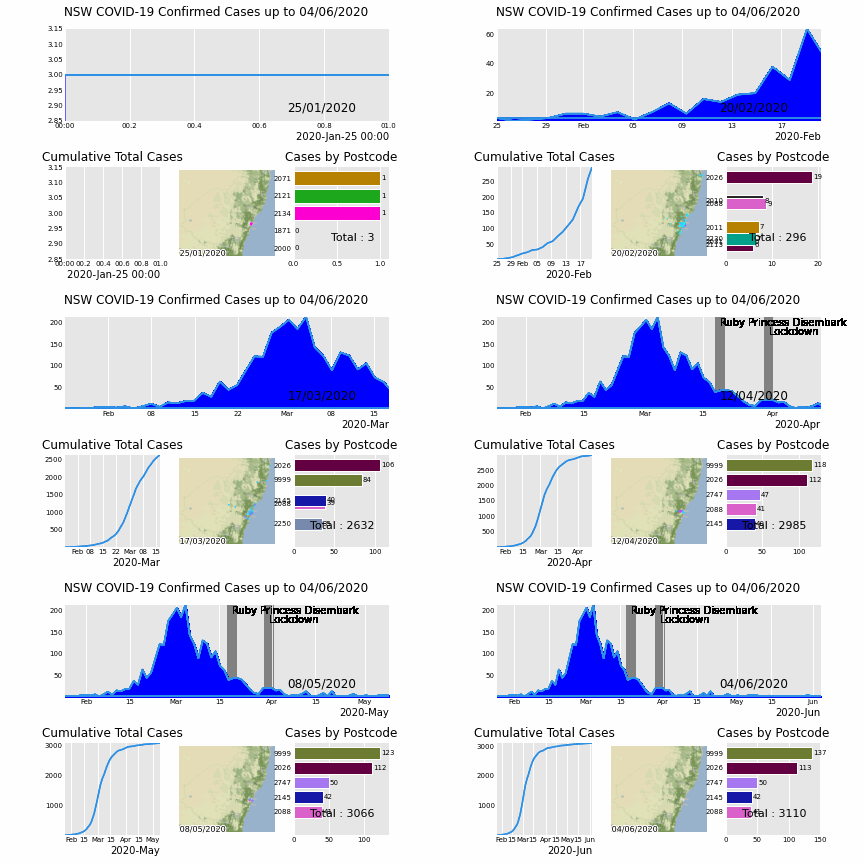
Following on from a previous post on making animated charts with pandas_alive, let's go into generating animated charts specifically for geospatial data with geopandas. Support for geopandas was introduced into pandas_alive in version 0.2.0, along with functionality to interface with contextily for enabling basemaps. The …


Continue reading

3D Gradient Descent in Python

Posted by Jack McKew on Wed 26 February 2020 in Python • Tagged with python, visualisation, generative • 40 min read

Visualising gradient descent in 3 dimensions

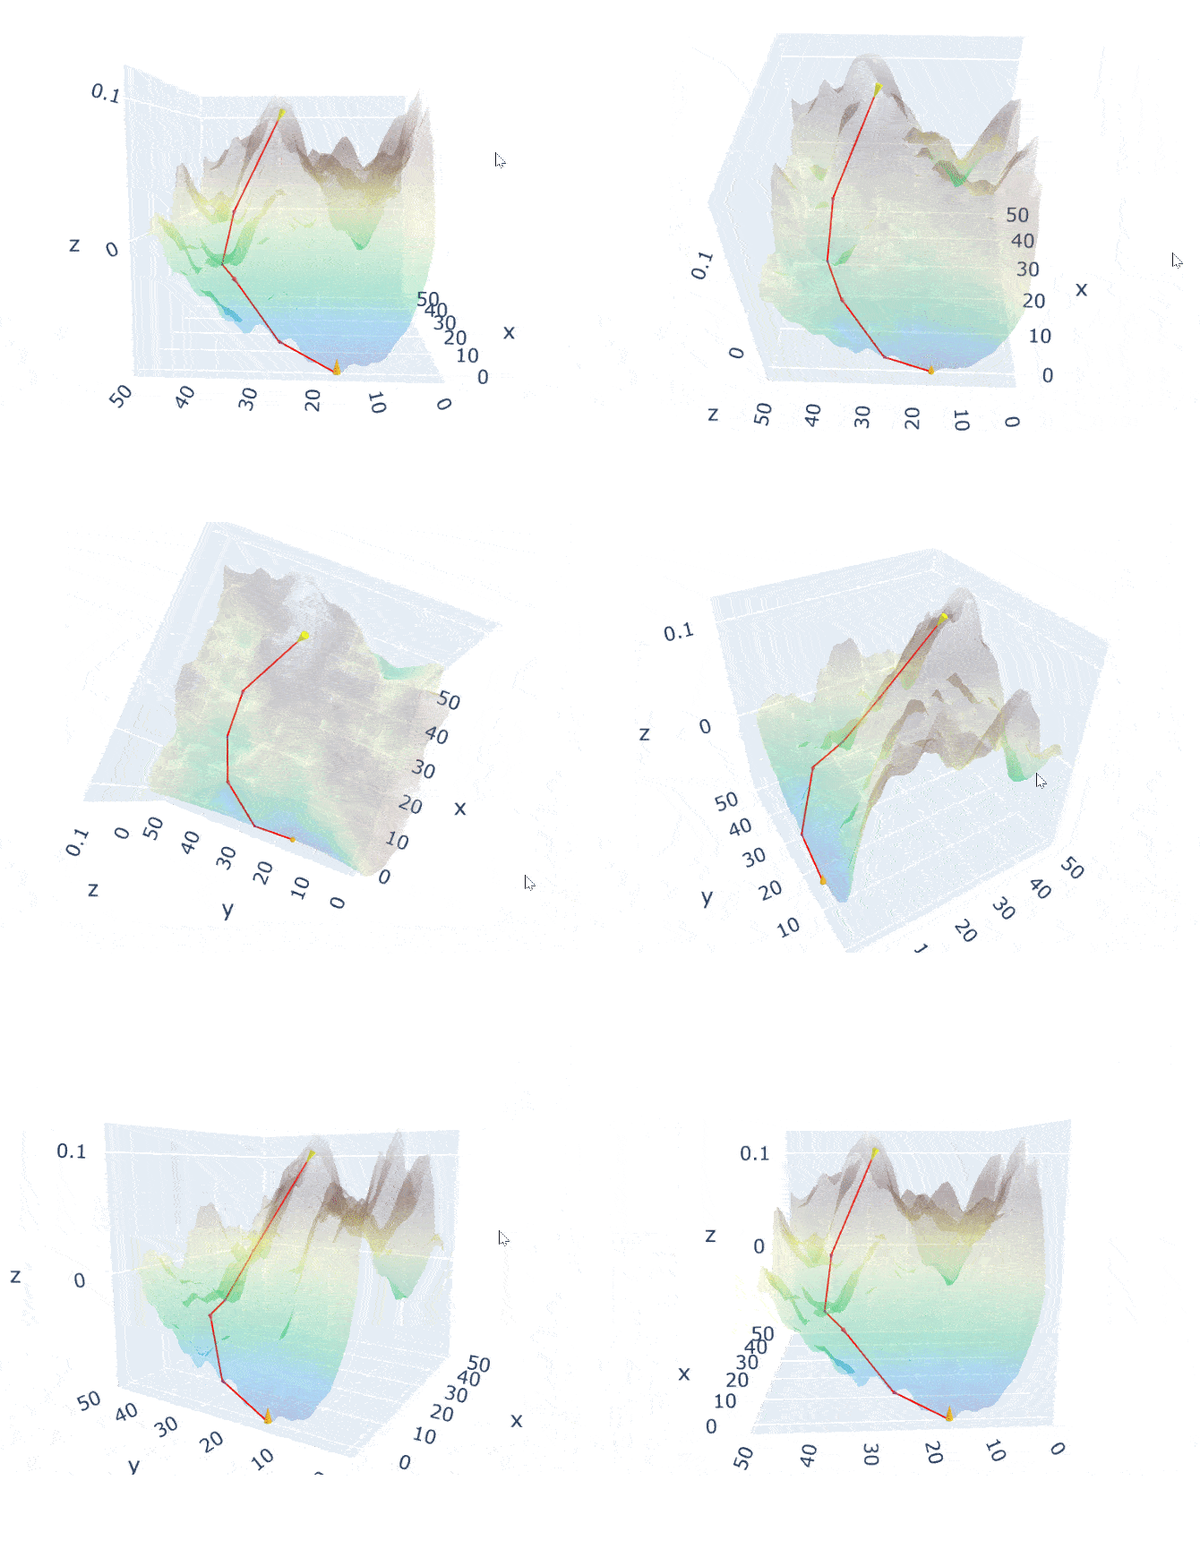
Building upon our terrain generator from the blog post: https://jackmckew.dev/3d-terrain-in-python.html, today we will implement a demonstration of how gradient descent behaves in 3 dimensions and produce an interactive visualisation similar to the terrain visualisation. Note that my understanding of gradient …


Continue reading

3D Terrain in Python

Posted by Jack McKew on Fri 24 January 2020 in Python • Tagged with python, visualisation, generative • 21 min read

Generating & Visualising 3D Terrains in Python

Today, let's put together a 3D visualisation of randomly generated 'terrain' with Python. Data visualisation is an absolutely key skill in any developers pocket, as communicating both data, analysis and more is thoroughly simplified through the use of graphs. While a picture tells a …


Continue reading

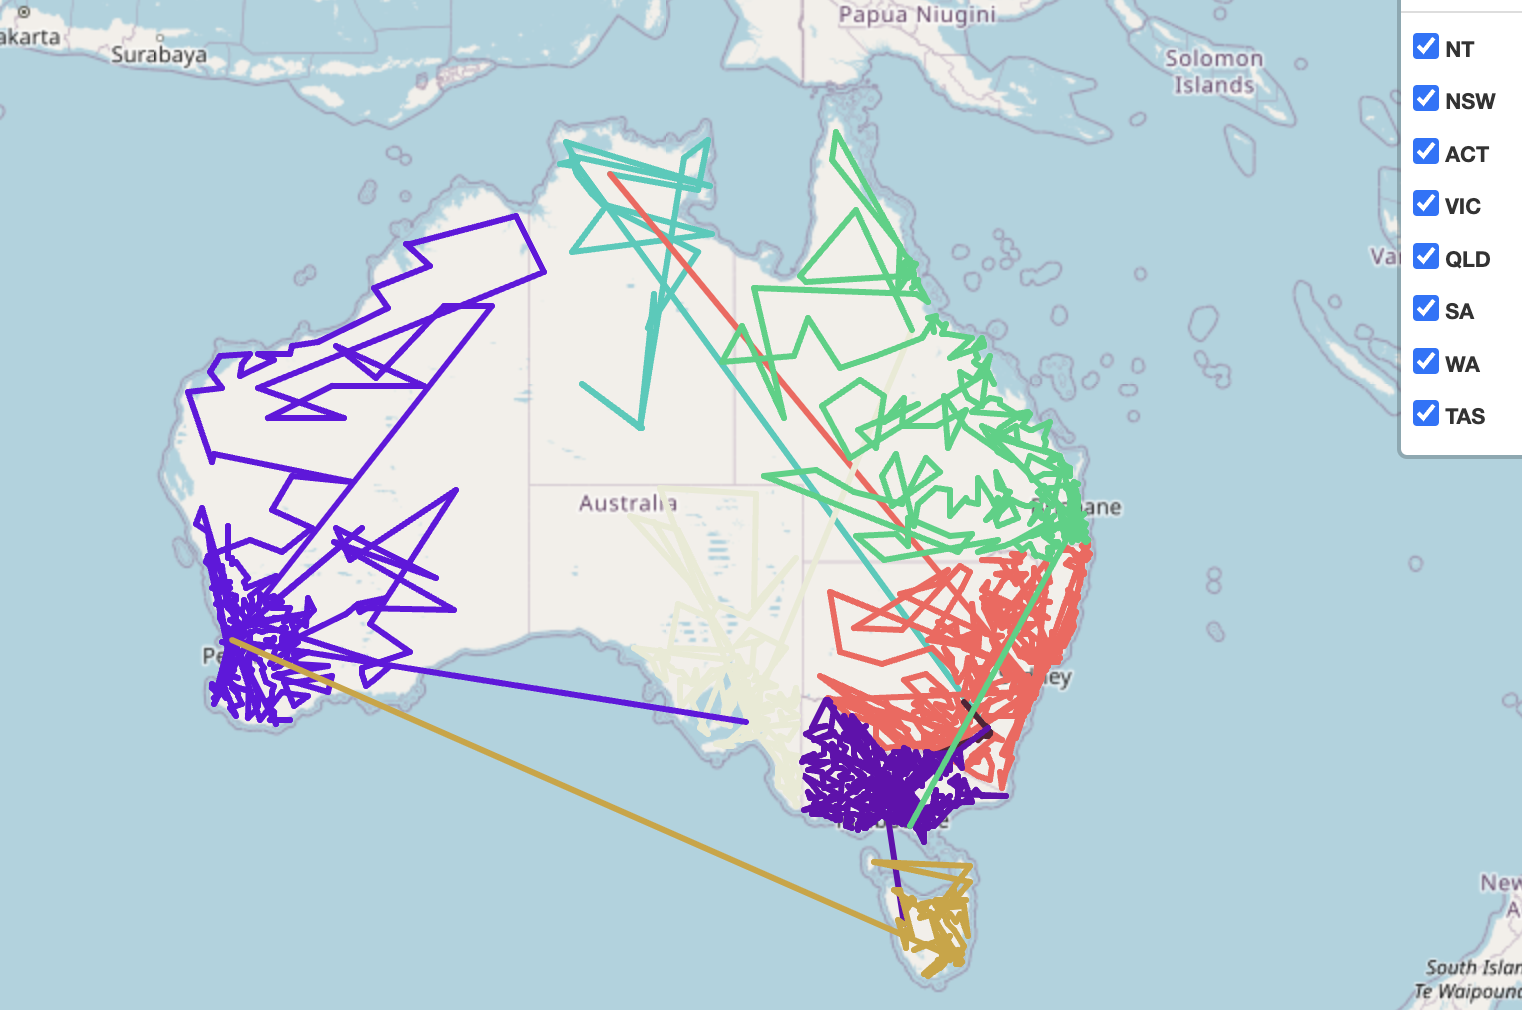
Intro To GeoPandas

Posted by Jack McKew on Wed 15 January 2020 in Python • Tagged with python, visualisation • 6 min read

Pandas for geospatial data

Personally whenever I am faced with a problem that involves analysing geospatial data, GeoPandas is the first tool/package I reach for. Extending on the Pandas dataframe data structure, GeoPandas brings functionality for working with points, polygons and more out of the box. This post is …


Continue reading